But this failed to push the price higher, XRP’s main technical indicators even hinted at the possibility of a short-term decline.
Fin whales gather for one reason only
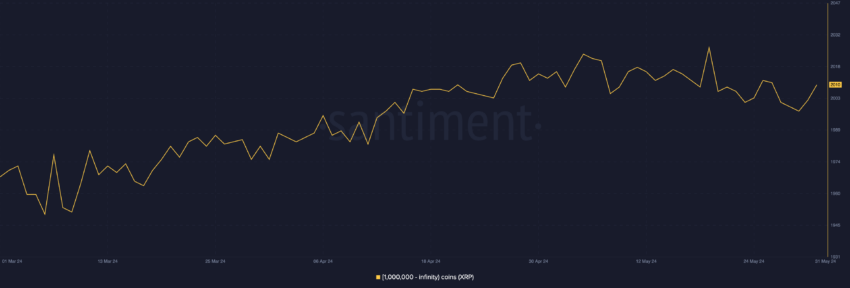
The number of whale addresses with more than 1,000,000 XRP has increased by 2% in the last three months. At the time of writing, this group of large XRP holders consists of 2010 addresses. On May 19, the total was 2,027, which by the way is a yearly high.

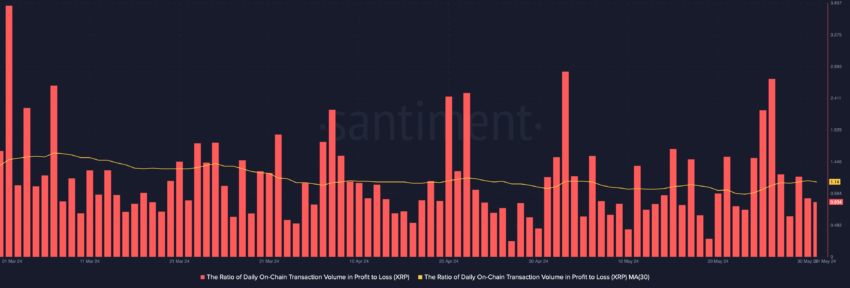
These XRP holders may have filled their bags for trading this altcoin in the past few weeks. The evaluation of the daily ratio of XRP trade volume to profit to loss brought a value of 1.14.
More information: XRP Predictions 2024/2025/2030

This means that for every XRP transaction made during the reporting period that ended in a loss, 1.14 ended in a profit instead. This indicates that there were more profitable trades than trades that resulted in losses for holders.
XRP Prediction: Bears are against price growth
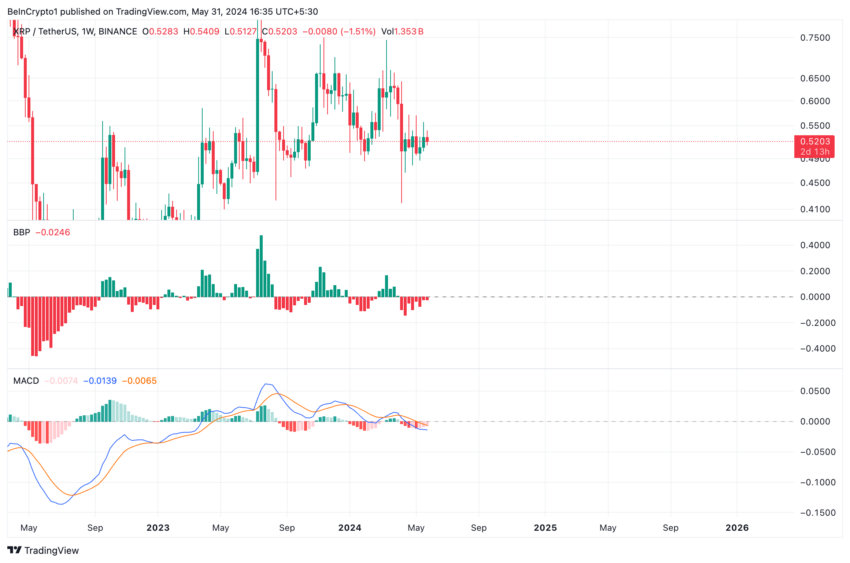
Despite the surge in whale activity and the recent profitability of XRP transactions, bearish sentiment remains high among traders. This is indeed what is implied by her Elder-Ray Index, which has ended every week in the negative since April 8.
This indicator measures buying and selling pressure in the market. When its value is negative, it means that the bear force is stronger than the bull force. This suggests that sellers are lowering the price more than buyers are raising it.
The XRP Moving Average Convergence and Divergence (MACD) indicator confirmed this bearish trend. Its MACD line (blue) crossed below the signal (orange) and the zero line.
This transition represents a bearish signal. It generally shows that the asset’s short-term trend is moving down and away from its long-term trend. This indicates a decrease in accumulation pressure and traders interpret this as a sign to exit the market or not to take long trades.

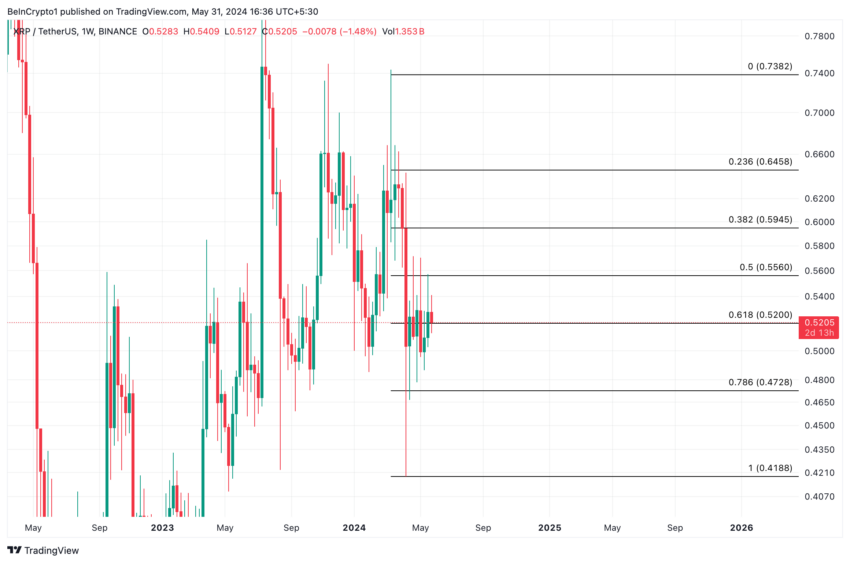
At the time of writing, the XRP MACD line is trending down, signaling a wave of selling in the token. If this trend continues, the value of the asset could fall below $0.5 to as low as $0.41.
More information : How to buy Ripple? Everything you need to know about this asset

However, if this projection is confirmed with increased demand for the altcoin and less profit-making activity, XRP could eventually rise to $0.55.
Moral of the story:
Disclaimer
Disclaimer: In accordance with The Trust Project guidelines, this price analysis article is for informational purposes only and should not be considered financial or investment advice. BeInCrypto is committed to providing accurate and unbiased information, but market conditions may change without notice. Always do your own research and consult with an expert before making any financial decision.
