However, as June dawns, some cryptocurrencies are poised to drop. Assets such as Cardano (ADA), Bitcoin Cash (BCH), Axie Infinity (AXS) and The Sandbox (SAND) have thus seen an increase in bearish sentiment. As a result, it exposes them to risks of short-term losses.
Cardano (ADA) has a strong position
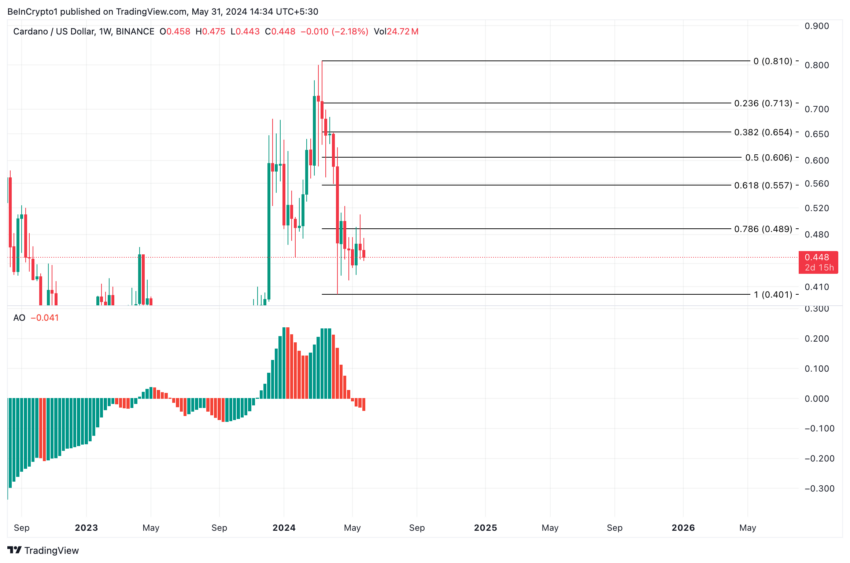
At the time of writing, Cardano is one of the cryptocurrencies currently under threat. The asset is trading at $0.44 after peaking at $0.50 on May 21, before falling 12%.
Its Awesome Oscillator (AO) confirmed the trend in the distribution of ADA tokens. Actually because the indicator returned red histogram bars. This indicator measures market momentum and identifies the asset’s current trend and potential price reversal points.
When an asset’s AO shows red bars, its short-term momentum is falling faster than its long-term momentum. Red bars generally indicate an increase in selling pressure and indicate an upcoming decline in prices.
We remind you that the ADA AO returned the red stripes only from April 1. This indicates that the bearish bias has dominated the price of this asset for more than 60 days.
Read more: How to buy Cardano (ADA) and everything you need to know

If the selling pressure continues to intensify, the price of ADA could fall to $0.40. The last time the asset traded at a similar price was in December 2023.
Well-hidden Bitcoin Cash (BCH) bulls.
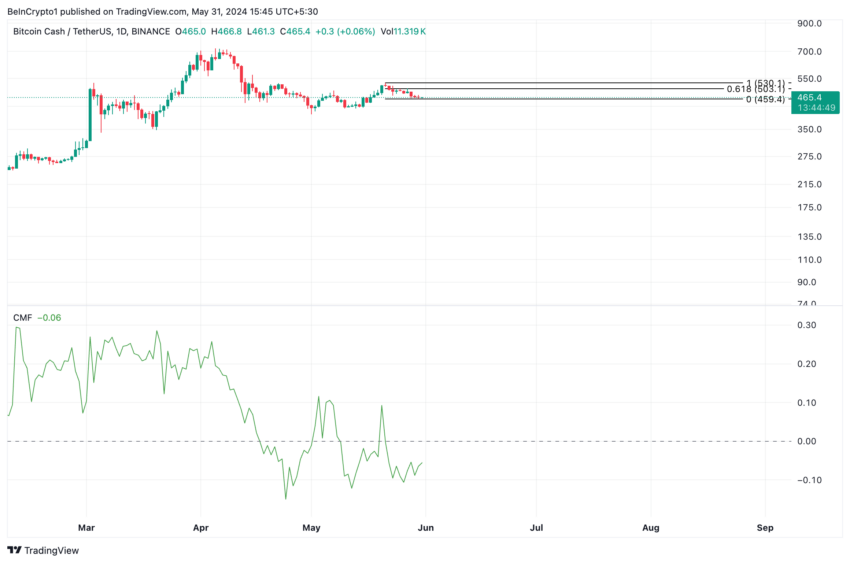
The price of Bitcoin Cash (BCH) has fallen by more than 10% in the last ten days. This is explained by strong capital flight, which was confirmed by its Chaikin Money Flow (CMF) data.
This indicator measures the inflow and outflow of money for the BCH token. Traders use it to get an idea of the strength and direction of a trend. A force can be evaluated based on the value when it is positive and greater than zero. This indicates high buying pressure with the influx of money.
Conversely, a negative CMF value indicates that there are more sellers than buyers. Unfortunately, this is the first sign of falling prices.
The altcoin’s CMF has been below the zero line since May 23. At the time of writing, the indicator value is -0.06.
Moreover, the points that make up the BCH Parabolic Stop and Reverse (SAR) indicator have confirmed increasing selling pressure, especially in the last few days. This indicator also tracks the price trend of the asset.

When its points are above the price of the asset, the market is said to be falling due to an increase in selling activity. If this BCH distribution trend continues, its next price target could be $459.4.
Axie Infinity (AXS) is headed for more losses
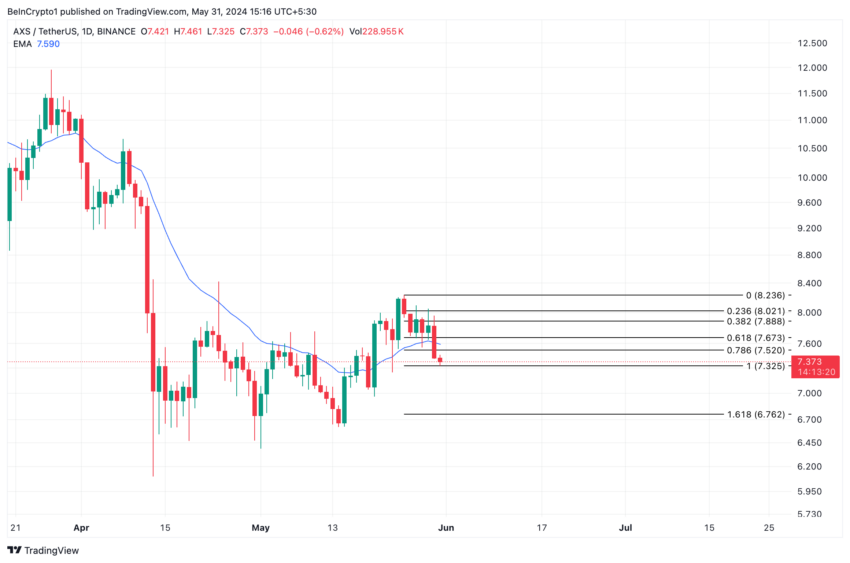
The price of AXS, the management token of Axie Infinity’s play-for-earning platform, increased by 11% last month. However, as its price dips below its 20-day exponential moving average (EMA), it looks set for a sharp increase in selling pressure. As a result, AXS could also be one of the cryptocurrencies to lose some of its gains.
The 20-day exponential moving average is important because it helps track the average price of an asset over the last 20 days. When the price of an asset falls below this key moving average, it indicates a shift from buying to selling. This is a bearish signal and traders interpret it as a sign of a trend reversal, from an uptrend to a downtrend.
Read more: Axie Infinity (AXS) explained for beginners

If the selling pressure on AXS continues to skyrocket, its price could fall as low as $7.3. Then, if profit taking continues, the price could fall to $6.76.
Sandbox (SAND) is subject to various sales
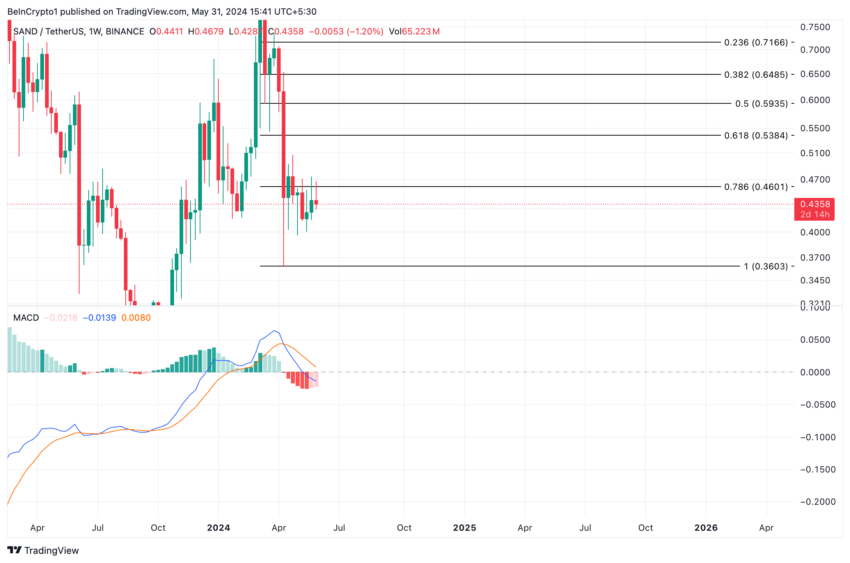
The latest cryptocurrency to be affected is The Sandbox (SAND). The short-term value of the SAND token is negative, with the asset falling below its long-term average. This strongly bearish signal is interpreted by market participants as an indicator for taking short positions and exiting long positions.
This indicator is used to identify changes in trend, momentum and strength of an asset. As observed in the current SAND setup, when the MACD line (blue) crosses the signal line (orange), traders are more confident in selling because they believe it is the right time.

If the selling waves for SAND gather strength, The SandBox asset could drop below $0.4 and go as low as $0.36.
Moral of the story: cryptocurrencies at risk of a downturn? Common currency in this sector.
Disclaimer
Disclaimer: In accordance with The Trust Project guidelines, this price analysis article is for informational purposes only and should not be considered financial or investment advice. BeInCrypto is committed to providing accurate and unbiased information, but market conditions may change without notice. Always do your own research and consult with an expert before making any financial decision.
